Code
Commonly requested code from studies
The effect of large-scale anti-contagion policies on the COVID-19 pandemic. Hsiang et al (Nature, 2020). Code Ocean capsule. Github repository. Other study information.
Spatial First Differences. Working Paper. Replication Code. R package (please cite Druckenmiller & Hsiang 2018 when using).
Code for "Estimating global agricultural effects of geoengineering using volcanic eruptions" by Proctor, Hsiang, Burney, Burke, & Schlenker (Nature, 2018)
Code for "Estimating Economic Damage from Climate Change in the United States" by Hsiang, Kopp, Jina, Rising, Delgado, Mohan, Rasmussen, Muir-Wood, Wilson, Oppenheimer, Larsen, Houser (Science, 2017).
Code for "Global Non-linear Effect of Temperature on Economic Production" by Burke, Hsiang, Miguel (Nature, 2015)
Code for “Quantifying the Influence of Climate on Human Conflict” Hsiang, Burke, Miguel, (Science 2013)
Adjust least-squares standard errors for spatial correlation and serial correlation in panel data. (Stata and Matlab code here) (The technique is GMM, as outlined by Conley 2008). Code is described here (please cite Hsiang 2010 when using).
Data visualization tools
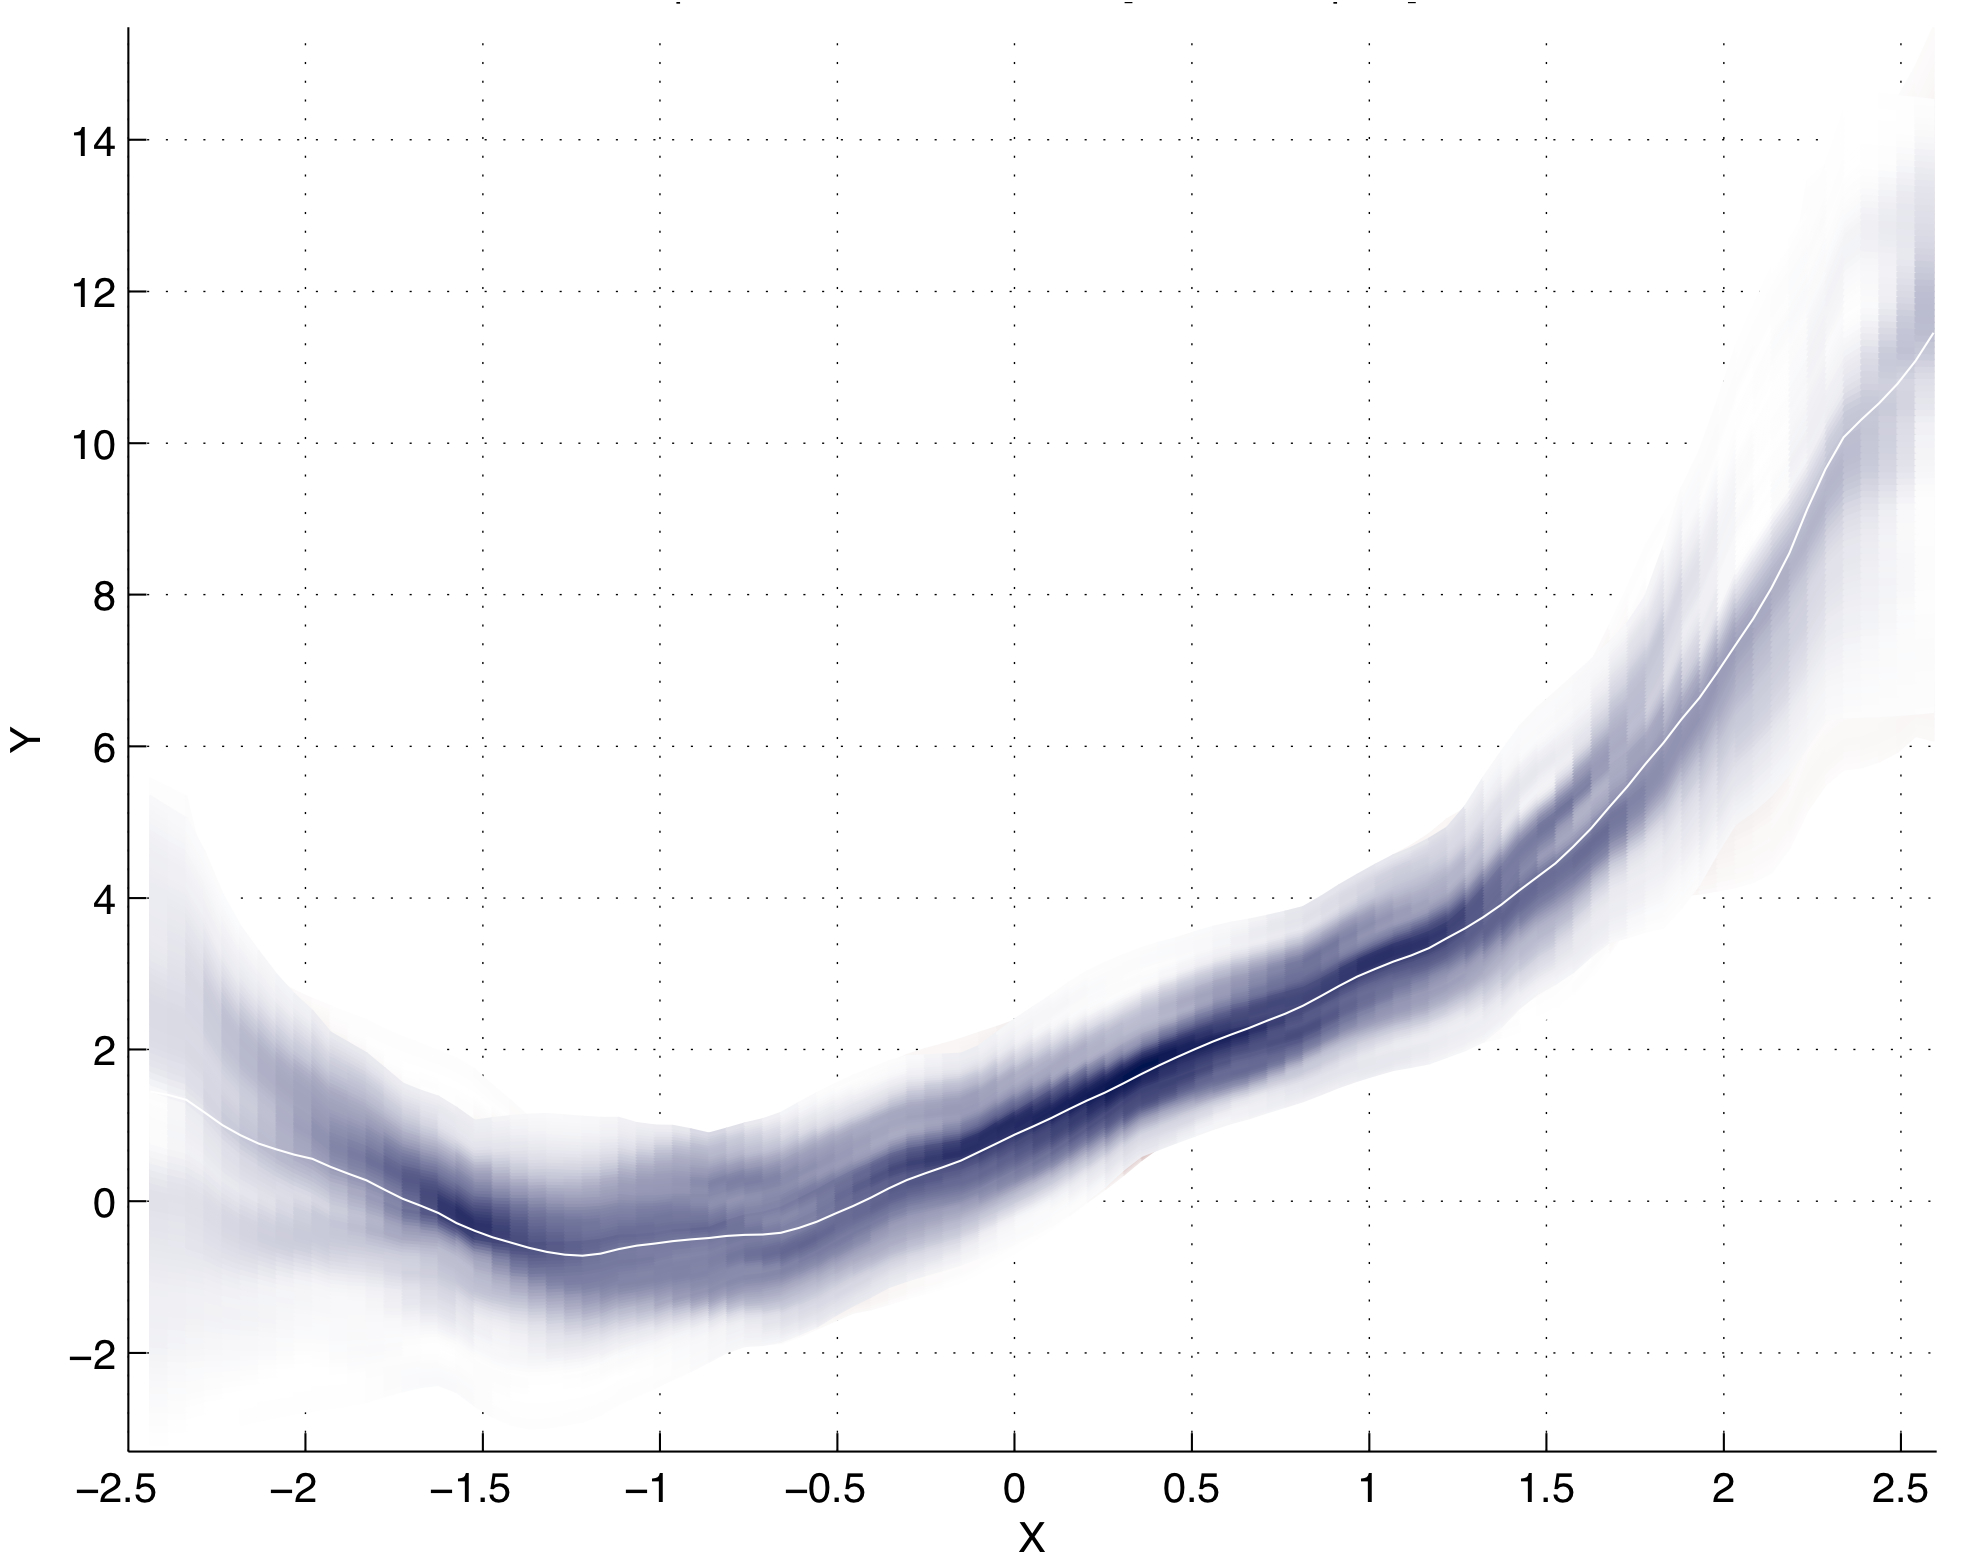
Watercolor Regression (MATLAB) Display a smooth nonparametric distribution of the probability density for a nonparametric regression estimate. Code is here. Watercolor regression (described here) is a type of visually-weighted regression (described here). Citation: Hsiang (2012) "Visually-Weighted Regression" (here).

Visually-Weighted Regression (STATA & MATLAB) Use the color-saturation of a regression line to denote the statistical confidence in the regression line at each point. Code is here. Described here with several options demonstrated here and the "watercolor regression" option described here. Citation: Hsiang (2012) "Visually-Weighted Regression" (here).

Three-Dimensional Nonparametric Regression (MATLAB) Flexibly estimate means conditional on two variables with bootstrapped confidence intervals. Code is here.

Boxplot Regression (MATLAB) Discretize an independent variable and use boxplots as a nonparametric regression. Code is here.
Older utilities
Move data back and forth between Stata and Matlab. Code here. Usage is described here.
Partial-out two variables from a model and plot them with a single command. (Stata) Code here.
Non-parametric regression for one or two independent variables (Matlab) Code here. described here.
Generate and analyze random networks (Matlab) Poisson, Watts-Strogatz, generate overlapping stars, plotting, computing empirical connection density, clustering coeff. Code here.